Property Performance Intelligence
Before You Buy, Sell, or Rent —
Know Your Property's IQ.
Multi-source data. Your specific market. Human analysts. PropertyIQ delivers the most comprehensive property performance analysis available — so realtors, investors, and homeowners can stop guessing and start optimizing with clarity.
Robust, Multi-Source Data
We cross-reference data from multiple STR platforms, market benchmarks, Airbnb and Vrbo host dashboards, local MLS records, STR regulatory databases, and hand-picked comparables — all calibrated specifically to your property and its market. No single source. No guesswork.
Full-Range Clarity Before You Commit
Conservative, median, and optimized projections across STR, MTR, Hybrid, and LTR strategies — modeled side by side so you have complete clarity on every scenario before you invest or commit.
Blueprint to Optimization
Every report includes a prioritized Blueprint to Optimization — the exact pricing, listing, and operational moves to achieve the highest ROI from your property. Not generic advice. Your specific path.
What Is a PropertyIQ Report?
Before You Buy, Sell, or Rent — Know Your Property's IQ.
PropertyIQ models every strategy side by side — STR, MTR, and LTR — so the right move is clear before you commit. Built for realtors, investors, homeowners thinking of transitioning to renting, and those who need actual data — not guesswork.
Validate the investment before you close. Revenue projections across STR, MTR & LTR with verified comps from your exact market.
Identify the rental strategy that earns the most for your specific property. Real comps, real data, real market — not national averages.
Know which rental strategy — STR, MTR, or LTR — maximizes your return before you commit. Make the right move with data, not assumptions.
Built For
Who Uses PropertyIQ
Whether you're buying, selling, optimizing, or advising — PropertyIQ delivers the data-driven clarity to make the right move with confidence.
Invest with confidence.
- ✓Revenue projections across STR, MTR & LTR
- ✓Verified comp data from your exact market
- ✓Market analysis before you commit capital
- ✓DSCR loan support with documented STR income
Close faster. Build loyalty.
- ✓Your brand, our analysis — white-label ready
- ✓Give clients the income data to say yes
- ✓Differentiate in a crowded market
- ✓Earn referrals through data-driven client wins
Optimize every dollar.
- ✓Optimize STR, MTR & LTR strategy side by side
- ✓Real market comps — not national averages
- ✓Personalized revenue roadmap for your property
- ✓Listing diagnostics + revenue gap analysis
Make the right move — with data.
- ✓Know if STR, MTR, or LTR is your best option
- ✓Compare income vs. sale proceeds side by side
- ✓Understand your property's true income potential
- ✓Make an informed decision before you commit
What You Get
Four Things Every PIQ Delivers
Does the purchase, sale or rental decision make sense at this time?
Full financial model: income, expenses, and net return — before you commit. The answer is specific to the property, its market, comparables, and regulatory factors.
Which strategy performs best?
STR, MTR, or LTR — modeled side by side with listing diagnostics and a clear optimization blueprint. The answer is specific to the property, its market, comparables, and regulatory factors.
How to maximize asset value.
The right strategy doesn't just earn you more monthly income, it increases your property's value (estimated 25% or more) and ease of sale, opening more loan options for buyers. Specific to your property's layout, market position, and long-term investment goals.
Tax Strategy — The Advantage Most Investors Miss.
Short-term rentals are one of the few strategies that can generate significant tax savings in the same year you earn income — including offsetting W-2 income. Bonus depreciation, the 7-Day Rule, and REPS can unlock deductions of $40K–$150K+ on a cash-flow positive property. Your PIQ documents the exact figures your CPA needs to evaluate these strategies.
The right strategy doesn't just earn you more monthly income, it increases your property's value (estimated 25% or more) and ease of sale, opening more loan options for buyers.
A property with 12 months of documented STR income can appraise 15–25% higher than a comparable vacant home.
Active Reports
Current PropertyIQ Analysis Reports
Password-protected reports delivered directly to you. Access codes provided upon order confirmation.
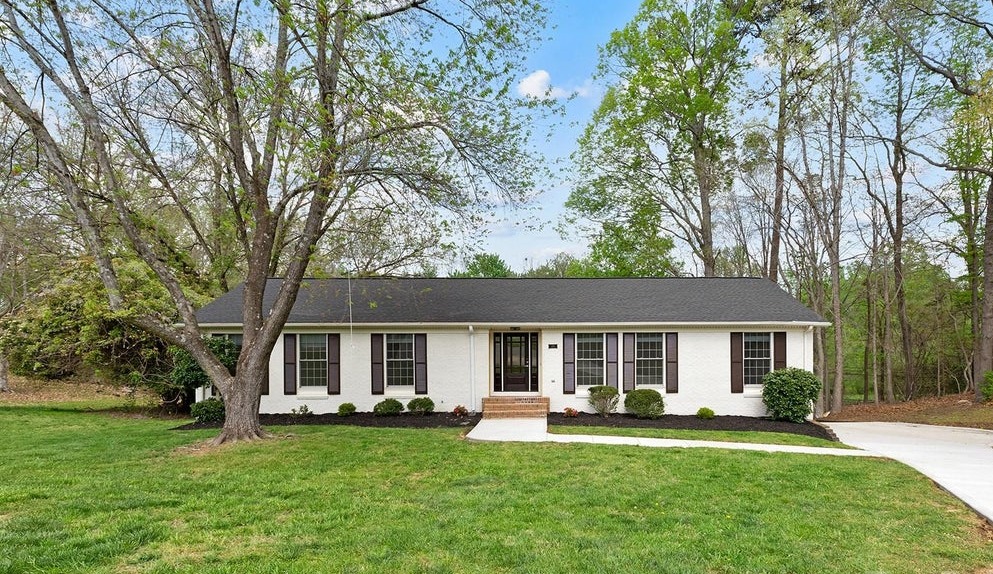
Charlotte Stays Estate
Full-brick ranch on a safe cul-de-sac with no through traffic — 0.7-acre fenced lot, SouthPark schools corridor, and a split floor plan built for 3 independent listings. The ideal family STR in Charlotte's premier investment corridor.
Password required · Contact Stays Optimized LLC for access
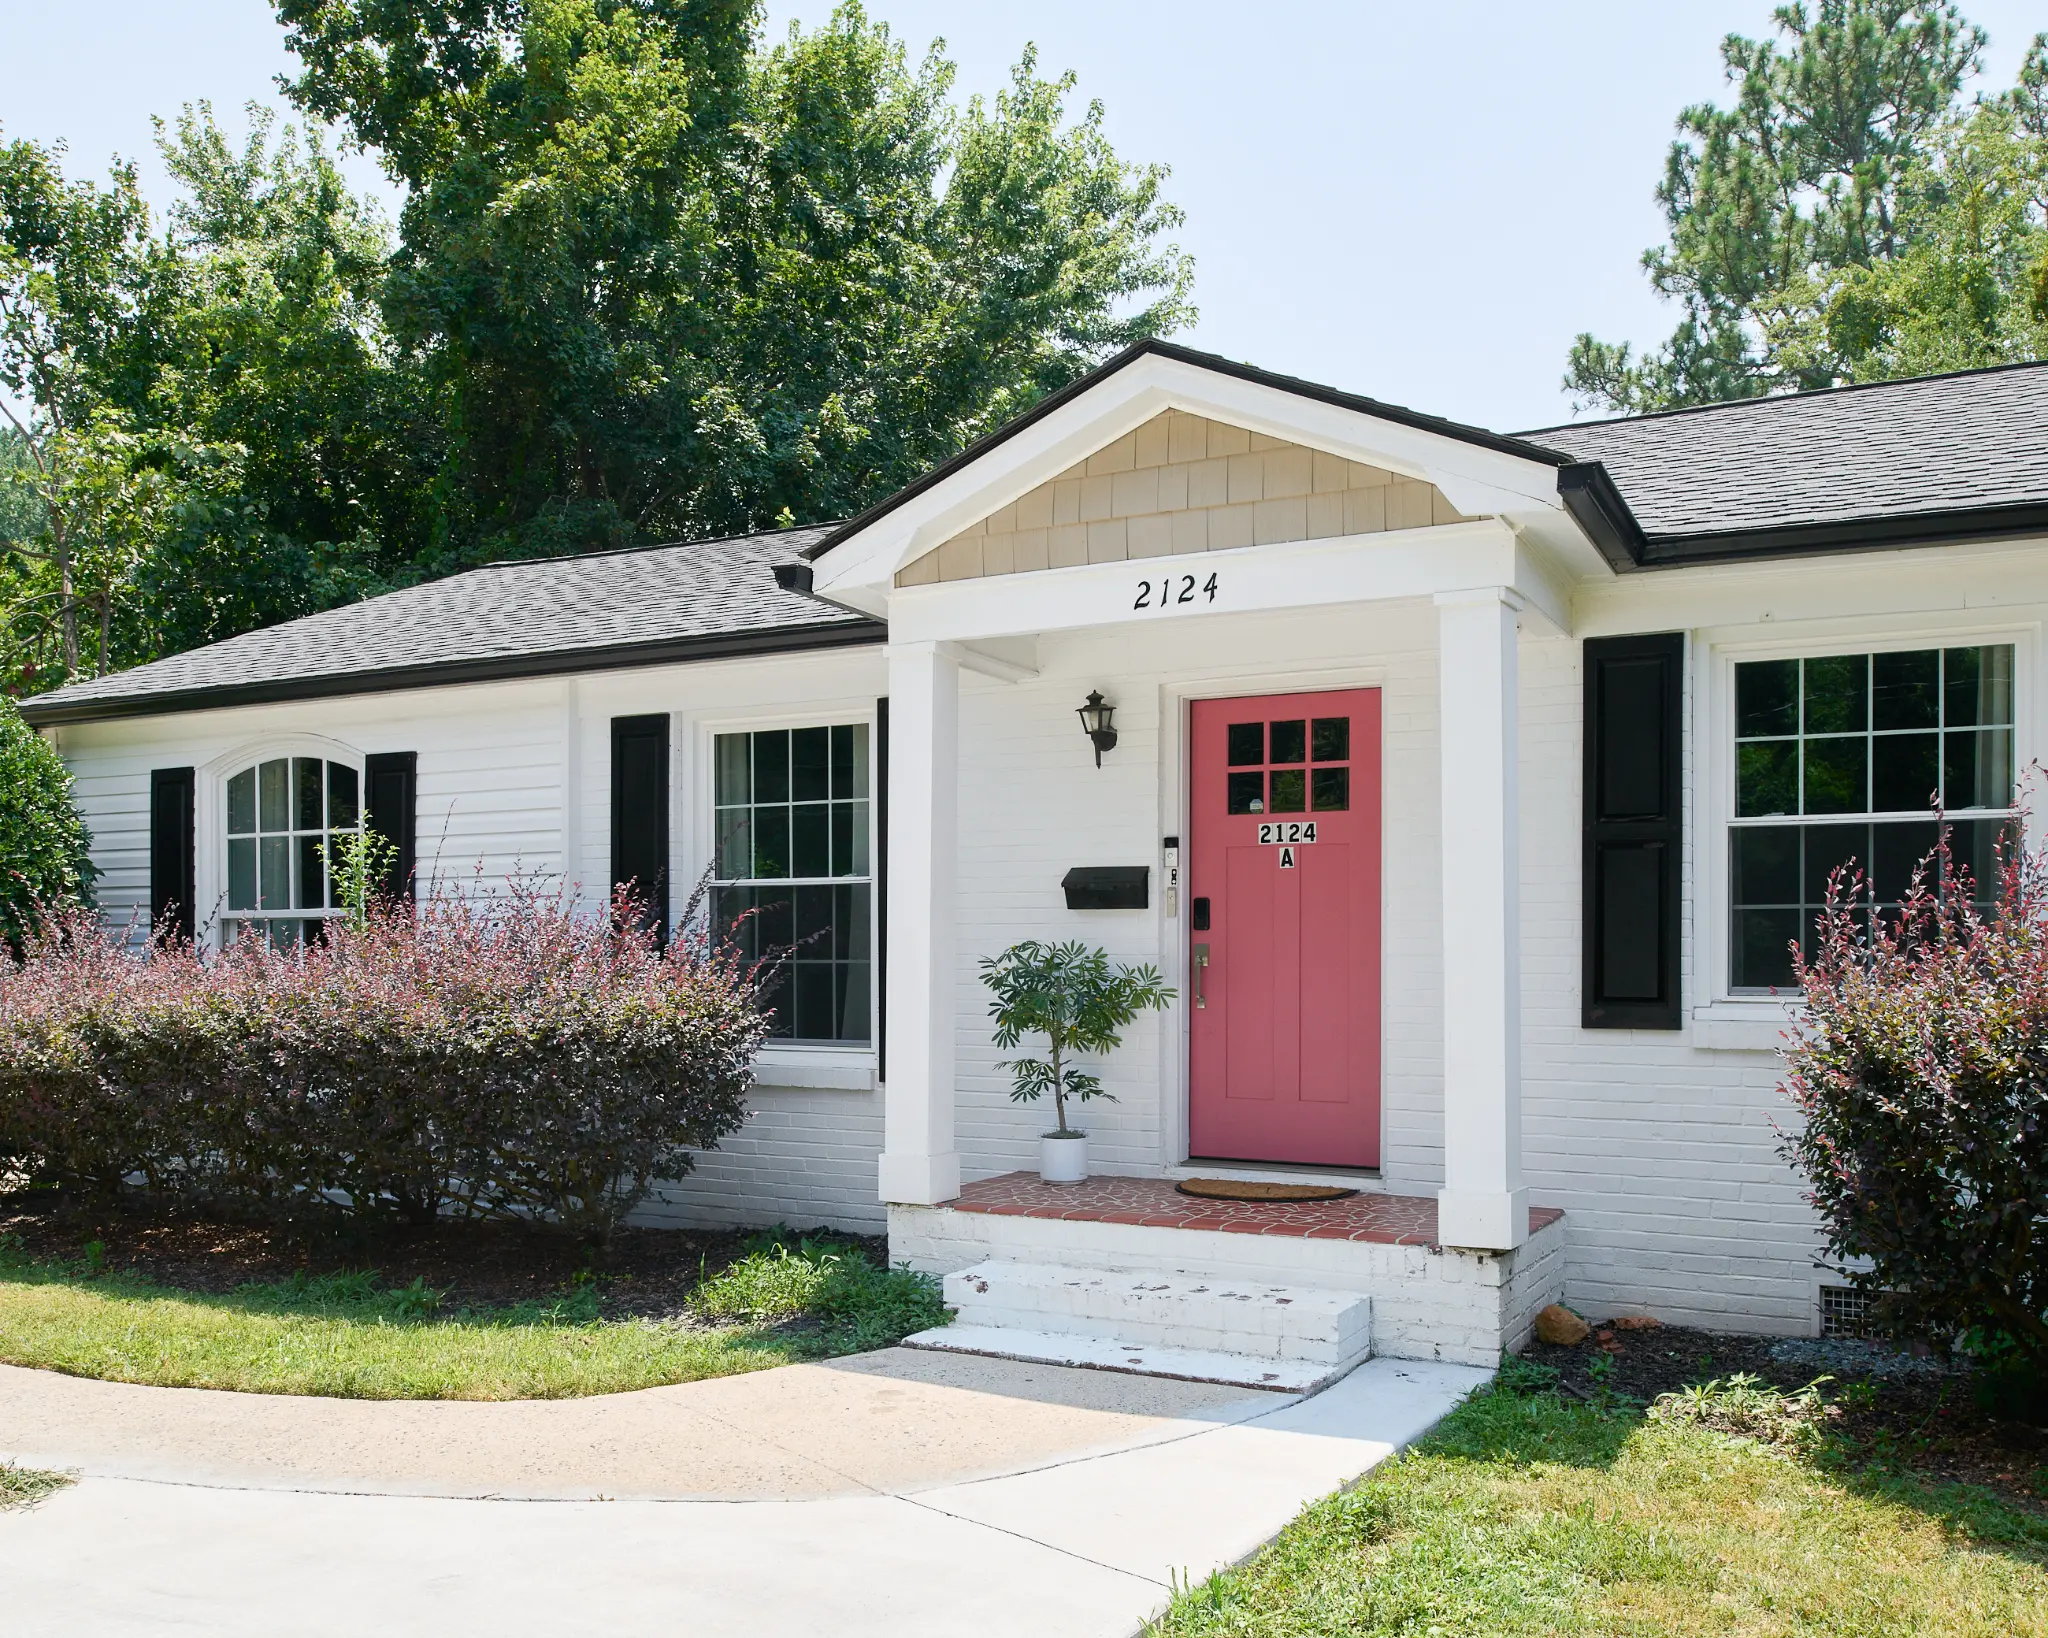
2124 Tyvola Rd
Password required · Contact Stays Optimized LLC for access

412 Fairview Ave
Password required · Contact Stays Optimized LLC for access

Retreat House NY
6,000 sq ft luxury estate on 90+ private acres in the Catskills — featured on Staycations (The Destinations Channel, May 25, 2026). A flagship Stays Optimized case study delivering $185K–$220K gross annually.
Password required · Contact Stays Optimized LLC for access

730 SE 3rd Terrace
Password required · Contact Stays Optimized LLC for access
The Process
How PropertyIQ Works
We give you the blueprint. You decide how to execute it.
Every PropertyIQ report delivers a clear, property-specific roadmap — the pricing strategy, listing gaps, amenity upgrades, and rental approach that will maximize your ROI. You can take that blueprint and implement it yourself, or tap into our network of trusted professionals who specialize in exactly this.
Our preferred partners offer hands-on support for implementation and ongoing property management services — so whether you want full control or full-service, you have options.
Use your report as a step-by-step action plan. Every recommendation is specific, prioritized, and ready to execute on your own timeline.
Connect with our vetted network of STR managers, listing optimizers, and property operators who can implement your blueprint and manage your property for maximum performance.
Built For
Who Uses PropertyIQ
PropertyIQ is the Airbnb investment analysis and STR property report used by investors, realtors, and operators who need to know the highest-performing strategy for a specific property — before committing capital, listing, or advising a client. The analysis also supports DSCR loan qualification by documenting projected STR income.
Real Estate Investors
Evaluating a purchase? Know whether STR, MTR, or LTR delivers the best ROI before you close. Cross-referenced comps, revenue projections, and a clear buy/hold/pass recommendation specific to the property. Supports DSCR loan qualification with documented STR income projections.
Realtors & Brokers
Add a PropertyIQ Airbnb investment analysis to your listing package or buyer presentation. Differentiate your service by showing clients the income potential — STR, MTR, and LTR — of any property you represent. Delivered in 48 hours or less.
STR Operators & Hosts
Already running a short-term rental? Get listing diagnostics and a revenue optimization blueprint specific to your property, market, and comparable listings. Know exactly what to adjust to increase ADR, occupancy, and annual revenue.
Property Owners Transitioning to Renting
Thinking of renting instead of selling? A PropertyIQ report shows you what the property could earn as an STR, MTR, or LTR — and how 12 months of documented STR income can increase your appraised value by 15–25%.
For Real Estate Professionals
Offer PropertyIQ to Your Clients — Under Your Brand.
Realtors who offer PropertyIQ analysis as part of their service close more deals, attract more serious buyers, and differentiate themselves in a crowded market. Our white-label partnership lets you deliver the most comprehensive property performance analysis available — with your name on it.
How the Partnership Works
The Advantage Most Investors Miss
Your STR Could Be a Tax Strategy — Not Just an Income Stream.
Increase your property’s value up to 25%
Short-term rentals are one of the few investment vehicles that can generate significant tax savings in the same year you earn income. Most property owners never realize this — because no one runs the numbers for them. Your PIQ does.
Bonus Depreciation
Accelerate deductions on furnishings, appliances, and improvements — often $20K–$60K+ in year one alone.
The 7-Day Rule
STRs with an average stay under 7 days qualify for different tax treatment than long-term rentals — unlocking deductions LTR owners can't access.
W-2 Income Offset
Qualifying STR losses can offset your regular W-2 income — reducing your total tax bill by thousands per year.
REPS & Material Participation
Real Estate Professional Status and material participation rules can unlock passive loss deductions that most CPAs overlook.
Included in Every PIQ Report
Your PropertyIQ report documents the specific figures your CPA needs to evaluate Bonus Depreciation, the 7-Day Rule, REPS, and W-2 offset strategies — tailored to your property's income, purchase price, and holding period.
Live Reports
Recent PropertyIQ Reports
Each report is a full STR · MTR · LTR analysis — cross-referenced with real comps, market data, and regulatory factors — specific to the property.
Pompano Beach · FL
730 SE 3rd Terrace
Pompano Beach, FL 33060
$101,200+
STR/yr
$78K
MTR/yr
$66K
LTR/yr
AirDNA · Rabbu · AirROI · Airbnb Comps — cross-verified
Charlotte · NC
Tyvola Rd Portfolio
Charlotte, NC — 2-Listing Strategy
STR
Stays Charlotte
STR
Charlotte Suite
Catskills · NY
The Retreat House NY
Wurtsboro, NY — Catskills Luxury
6BR
Bedrooms
5.5BA
Baths
Real Results · Verified Data
Case Studies — Properties We Manage
These aren't projections from a template. Every number below is sourced directly from verified Hospitable PMS data, AirDNA market benchmarks, and Airbnb host dashboards — for properties actively managed by Stays Optimized LLC.
Charlotte STR Portfolio
2-Unit Property · 2-Listing STR Strategy · Superhost ★ 4.92
Verified Combined Revenue · 9 Months
$52,735
2-listing strategy · Aug 2025–May 2026 · Hospitable verified · 105 reservations
Front Unit ADR
$191.57
verified · vs. market avg $145
Front Unit Occupancy
63%
verified · vs. market 59%
Suite ADR
$190.82
verified · vs. market avg $115
PIQ Target ADR
$234
PIQ-Modeled Target ↑
✕ Before PropertyIQ
Single listing · LTR considered · $2,200/mo · Suite space unused · No strategy in place
✓ After PropertyIQ
2-listing STR strategy · $52,735 verified (9 mo.) · Suite monetized Nov 2025 · PIQ-Modeled 12-mo target: $126,200
Strategy Applied
Two independent Airbnb listings on a single property — front unit (2BR/2BA) + executive suite (1BR) — generating two revenue streams without cannibalizing each other. Suite came online November 2025. Combined verified revenue: $52,735 in 9 months (105 reservations, 253 booked nights). PIQ-Modeled 12-month optimization target: $126,200 at $234 ADR / 63%+ occupancy.
Retreat House NY
6BR · 6,000+ sq ft · 90-Acre Estate · ★ 5.0 · Superhost · Guest Favorite
Implied Annual Revenue · Verified Trailing 12 Mo.
~$105,000
May 2025–Apr 2026 · 67 booked nights · 25 check-ins · Airbnb verified
Avg Nightly Rate
$1,570
verified · Airbnb dashboard
Peak Month ADR
$2,530
October 2025 · verified
Peak Occupancy
88.9%
July 2025 · verified
Annual Occupancy
30.2%
67 booked nights · 12 mo.
✕ Before PropertyIQ
LTR at $3,150/mo · $37,800/yr · Unique amenities underutilized · Sell-vs-rent decision unresolved
✓ After PropertyIQ
Premium STR · ~$105,000 implied annual revenue · $1,570 avg ADR · Peak July 88.9% occupancy · $575K+ 5-yr premium vs. LTR
Strategy Applied
Premium large-group STR on a 90-acre Hudson Valley estate — indoor pool, barnyard animals, game room, and nature trails creating an unmatched amenity stack. Verified trailing 12-month performance: $1,570 avg ADR, 88.9% peak occupancy (July 2025), $2,530 peak ADR (October 2025). At the moderate scenario, the 5-year STR premium exceeds $575,000 vs. the LTR baseline of $37,800/yr.
Your Property
Could Be Next
Every PropertyIQ report is built from the ground up — your specific property, your specific market, your specific goals. The same analysis behind these results, delivered in 48 hours.
Delivery
48 hrs
Strategies
STR · MTR · LTR
Data Sources
4+ verified
Comps
Hand-picked
No commitment · Fully customized · 48-hour delivery
How It Works
The PropertyIQ Methodology
The most comprehensive property performance analysis available — cross-referenced across multiple independent data sources, calibrated to your specific property and market, and reviewed by a human analyst before delivery. No templates. No auto-generated outputs. Real intelligence, built for real decisions.
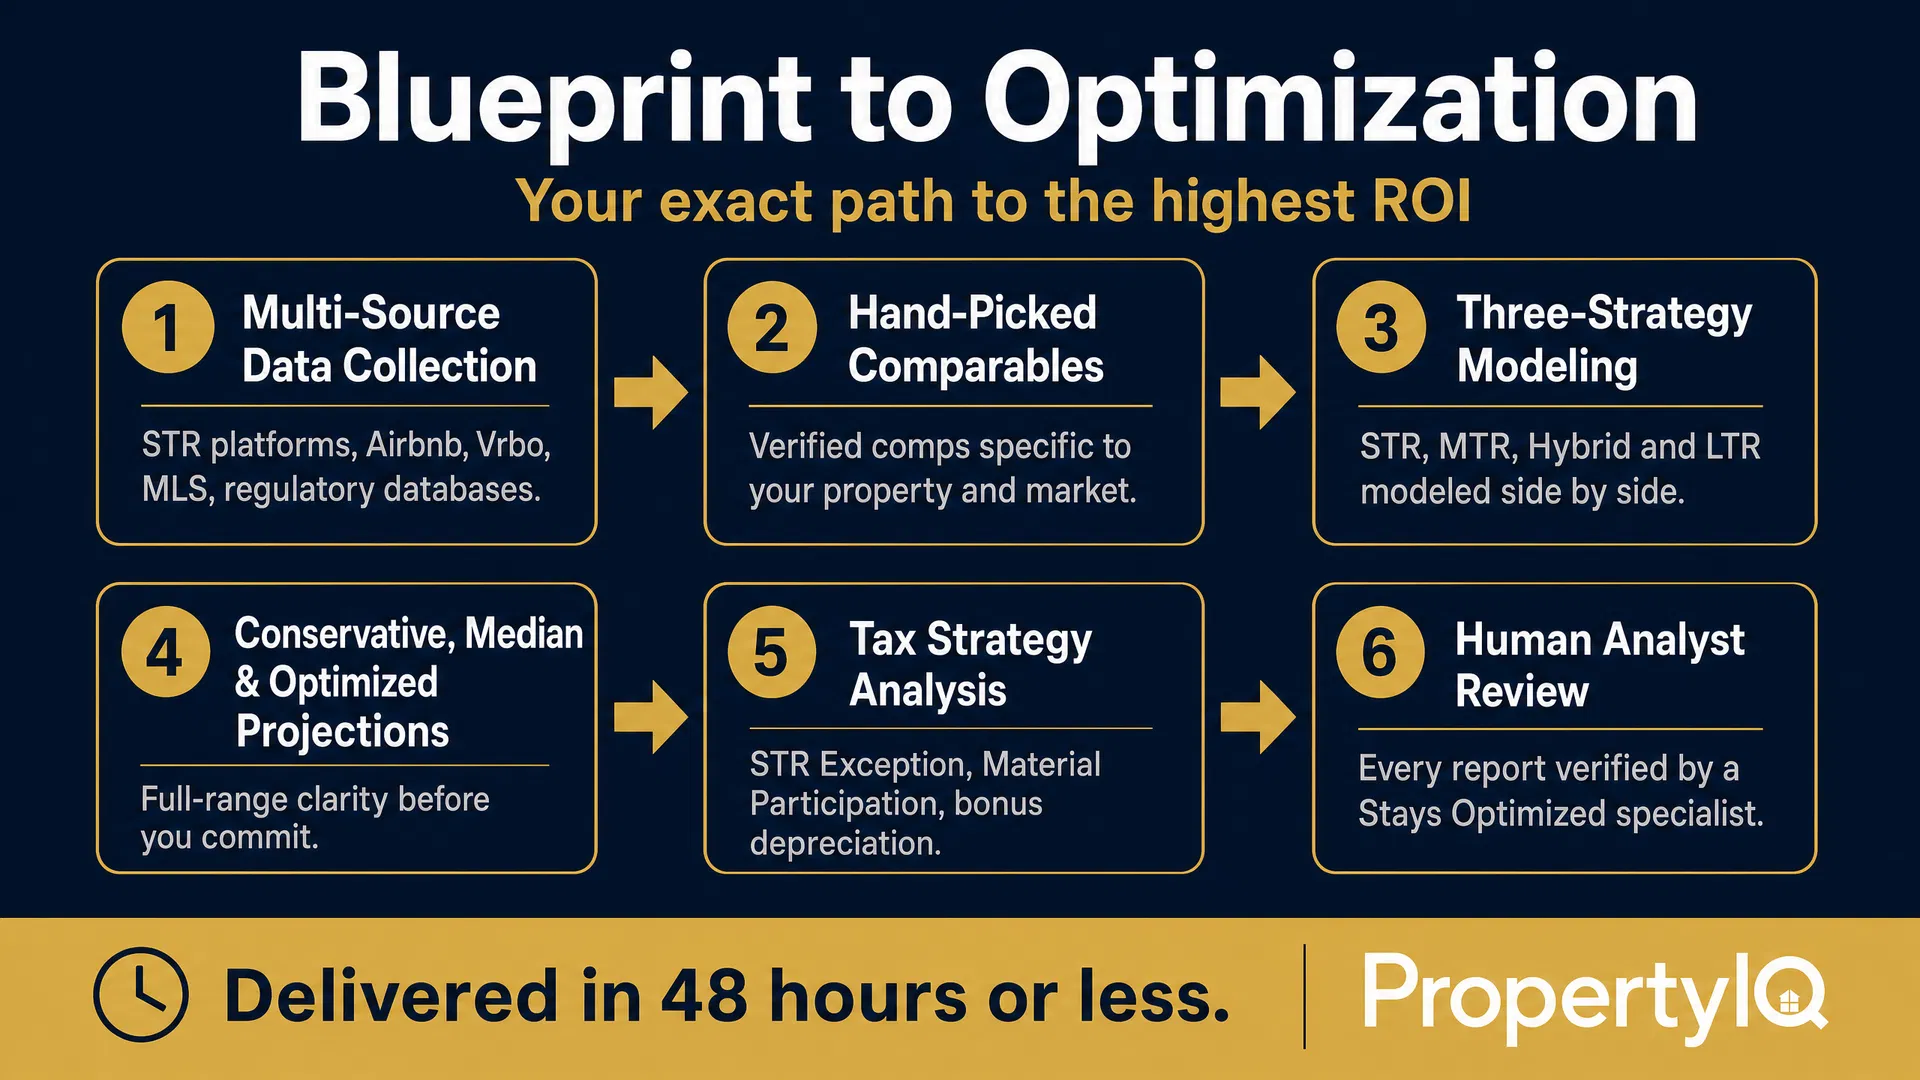
Multi-Source Data Aggregation
We pull from multiple STR management platforms — including PriceLabs, AirDNA, BnbCalc, Rentalizer, and more — alongside Airbnb and Vrbo host dashboards, local MLS records, STR regulatory databases, and multiple short-term rental listing platforms. No single source is trusted in isolation.
Hand-Picked Comparable Properties
Our analysts manually select comparable properties — not algorithm-matched listings. Comps are filtered by bedroom count, configuration, amenities, proximity, and verified performance history. Every comp is reviewed for accuracy before it enters your report.
Three-Strategy Side-by-Side Modeling
Your property is modeled across Short-Term Rental (STR), Mid-Term Rental (MTR), and Long-Term Rental (LTR) — each with conservative, median, and best-case projections. You see the full range of outcomes, not just the optimistic scenario.
Market Intelligence & Demand Drivers
We analyze your local market's demand drivers — seasonality, events, corporate corridors, regulatory environment, and competitive supply — to contextualize your property's performance potential within its actual competitive set.
Tax Strategy Analysis
Short-term rentals are one of the few investment strategies that can generate significant tax savings in the same year you earn income. Every PIQ report documents the STR Exception, Material Participation rules, bonus depreciation eligibility, and the 7-Day Rule — with the exact figures your CPA needs to evaluate $40K–$150K+ in potential deductions.
Blueprint to Optimization
Every report concludes with a prioritized Blueprint to Optimization — specific pricing strategy, listing recommendations, amenity upgrades, and operational moves ranked by ROI impact. Not generic advice. A customized action plan for your property.
Human Analyst Review — Every Report
Before your report is delivered, a Stays Optimized analyst reviews every data point, every projection, and every recommendation. We verify the numbers, validate the comps, and ensure the strategy is sound. You receive a report that a specialist has personally signed off on — not a dashboard export.
Delivered in 48 Hours or Less
From submission to delivery, your fully customized PropertyIQ report is in your hands within 48 hours. Complex multi-listing or estate properties may require additional time — we'll confirm your timeline at order.
Data Sources
PropertyIQ cross-references data from multiple independent platforms to ensure every projection is grounded in verified, current market intelligence — not a single-source estimate.
What Clients Are Saying
Real Decisions. Real Results.
“I was comparing three properties and couldn't decide which one made the most sense as an STR. The PropertyIQ report laid out the numbers side by side — conservative, median, and optimized — and it was obvious which one to move forward with. Made the decision easy.”
M.T.
Real Estate Investor — Nashville, TN
“My clients were on the fence about converting their home to a short-term rental. I brought in a PropertyIQ report and it completely changed the conversation. They saw the actual numbers, the tax strategy, the blueprint — and they made the decision to convert that same week.”
D.R.
Licensed Realtor — Scottsdale, AZ
“I've been using PropertyIQ reports with every investor client I work with. It's the fastest way to close. When they can see verified comps, STR vs. LTR projections, and a real optimization plan — they stop hesitating. I've shortened my close cycle significantly.”
A.K.
Licensed Realtor — Austin, TX
“I had no idea what my property could earn as an Airbnb. I thought maybe $2,000 a month. The PropertyIQ report showed me a realistic path to nearly double that — with the exact steps to get there. That blueprint was worth every penny.”
J.P.
STR Homeowner — Smoky Mountains, TN
“My buyer wanted a long-term rental. I ordered a PropertyIQ report and it showed the STR upside was 2.4x the LTR income. He changed his entire strategy on the spot. That report won me the deal and turned a hesitant buyer into a committed investor.”
S.M.
Licensed Realtor — Tampa, FL
“The tax strategy section alone was something I had never seen in any other analysis. My accountant reviewed it and confirmed everything was accurate. That section justified the cost of the report ten times over — I had no idea I could offset W-2 income this way.”
R.L.
Real Estate Investor — Denver, CO
Testimonials reflect representative client experiences. Names anonymized. Real quotes will be added as clients provide written consent.
Resources & Insights
The PropertyIQ Knowledge Base
Data-driven guides for property owners, investors, and real estate professionals navigating the short-term rental landscape.
Would My House Make a Good Airbnb? 7 Things to Check Before You List
Not every property is an Airbnb goldmine — and not every goldmine looks like one on the surface. Here's how to evaluate your property honestly.
Read ArticleSTR vs. LTR: Which Rental Strategy Is Actually Better for Your Property?
The STR vs. LTR debate is not a one-size-fits-all answer. The right strategy depends on your property, your market, and your goals.
Read ArticleShort-Term Rental Tax Strategy: How Bonus Depreciation Can Offset Your W-2 Income
Short-term rentals qualify for tax strategies that long-term rentals do not. Here's how bonus depreciation, the 7-Day Rule, and REPS work.
Read ArticleHow We Build Your Analysis
The PropertyIQ Data Stack
A PropertyIQ report is not a platform export or an algorithm estimate. It is a multi-source intelligence synthesis — built by human analysts who cross-reference 15+ independent data sources, apply market-specific judgment, and validate projections against live portfolio actuals before delivery.
No single platform tells the full story. We reconcile all of them.
Market Validation
Cross-referenced ADR, occupancy, and revenue estimates across multiple independent STR data providers — never a single-source estimate.
Revenue & Pricing Strategy
Dynamic pricing benchmarks, seasonal rate modeling, and real-time demand signals to maximize ADR without sacrificing occupancy.
Real Performance Benchmarking
Projections validated against actual Hospitable PMS data from our actively managed portfolio — not just market estimates.
Competitor Tracking
6–10 hand-selected active comps matched on beds, baths, property type, radius, and amenity profile — reviewed manually, not just algorithmically.
Investment Metrics
Cap rate, cash-on-cash return, gross yield, and 5-year income projections — modeled across conservative, moderate, and peak scenarios with LTR baseline comparison.
Regulations & Risk
STR permit requirements, HOA restrictions, zoning overlays, and market saturation signals flagged and disclosed — never buried. Risk factors are part of every report.
Complete Data Source Registry
We do not recommend a strategy before running the analysis. STR is not always the answer. LTR is not always the answer. MTR is not always the answer. The recommendation is determined by the data — specific to your property, its layout, your market, and your goals. Every projection includes a conservative, moderate, and peak scenario so you understand the realistic range, not just a single number.
Sample Report
See exactly what your PIQ delivers.
Below is a live preview of a real PropertyIQ report — built for a 4BR mountain cabin in Asheville, NC. Every number, comp, and projection shown is the same format you’ll receive for your property.
The Realtor Pack gives you 10 reports at $79.90 each — white-label ready, no expiration. Visit the sample and click “White-Label Preview” to see exactly how it looks.
Real comps. Real projections. Risk scoring. Pricing calendar. Listing blueprint. ROI summary. Tax Strategy. Everything you need to decide — and act.
The right strategy saves thousands.
The wrong one costs more.
Most investors choose a strategy first and then try to make the property fit. PropertyIQ flips that. We analyze the property first — its layout, market, comps, and regulatory environment — and the data tells you which strategy wins.
Become the Most Data-Driven
Realtor in Your Market.
Your clients are making six and seven-figure decisions. Give them the intelligence to decide with confidence — and position yourself as the realtor who always has the data. Your brand. Our analysis. Unmatched results.
The Realtor Advantage — Every Month.
Subscription members receive priority access to PropertyIQ's full analytical capabilities on a recurring basis — keeping your clients' properties and your investment recommendations competitively positioned month after month.
How the Partnership Works
Pricing
Simple, Transparent Pricing
Flat-fee reports delivered in 48 hours or less. Accurate projections with strategic ROI optimization & forecasting — or subscribe for ongoing monthly monitoring.
- ✓ STR, MTR & LTR revenue projections
- ✓ Real comp data from your exact market
- ✓ Listing gaps identified + fixes outlined
- ✓ Your personalized profit roadmap
- ✓ Delivered in 48 hours
- ✓ Full analysis on 2 properties
- ✓ Save $49 vs. ordering separately
- ✓ Side-by-side comparison included
- ✓ Delivered in 48 hours
- ✓ Full analysis on 5 properties
- ✓ Best rate — just $99.80 per report
- ✓ Portfolio-wide strategy overview
- ✓ Dedicated point of contact
- ✓ Priority delivery on all 5
10 full PropertyIQ reports — use for client presentations, pre-listing analysis, or buyer due diligence.
- ✓ 10 full property analyses
- ✓ Flexible use — any property type
- ✓ Priority 48-hour delivery
- ✓ Dedicated point of contact
- ✓ White-label option available
Ongoing ROI Optimization & Market Monitoring
Your market doesn't stand still — and neither should your strategy. Our monthly subscription keeps your property competitively positioned with updated comp analysis, seasonal pricing adjustments, and strategic ROI forecasting delivered on a recurring basis.
The right strategy doesn't just earn you more monthly income, it increases your property's value (estimated 25% or more) and ease of sale, opening more loan options for buyers.
A property with 12 months of documented STR income can appraise 15–25% higher than a comparable vacant home — more equity, stronger refinance options, and a higher sale price if you ever choose to exit.
Documented STR income raises appraised value vs. a vacant or LTR property.
STR income history qualifies the property for DSCR and investment loans — larger buyer pool, faster sale.
A cash-flowing asset with a track record sells faster and at a premium vs. a property with no income history.
Tax Advantage
The Tax Strategy Most Investors Don’t Know About
Short-term rentals are one of the few real estate strategies that can generate significant tax savings in the same year you earn income — including offsetting W-2 and active income. The key: STR losses are not automatically passive the way long-term rental losses are. If you materially participate, those losses can offset your other income dollar for dollar.
Your PropertyIQ report documents projected STR income, ADR, occupancy, and annual revenue — the exact figures your CPA or cost segregation specialist needs to evaluate these strategies. Full Tax Strategy analysis included in your paid report. Consult a qualified tax professional.
Get Started
Request Your PropertyIQ Analysis
Ready to know your property's true performance potential? Submit your details below and a member of our team will follow up within 24 hours to confirm your order and answer any questions.
FAQ
Frequently Asked Questions
Everything you need to know about PropertyIQ — the analysis, the process, the data, and the results.
What exactly is a PropertyIQ report?+
A PropertyIQ report is a full, customized property performance analysis that models your property across three rental strategies — Short-Term Rental (STR), Mid-Term Rental (MTR), and Long-Term Rental (LTR) — side by side. It includes revenue projections, verified comparable listings, market data, listing diagnostics, an optimization blueprint, and an Tax Strategy summary. It’s not a generic estimate — it’s specific to your property, your market, and your goals.
How is PropertyIQ different from a free Airbnb or AirDNA estimate?+
Free tools pull broad averages from a single platform and apply them to your address. PropertyIQ cross-references data from multiple sources, selects verified comparable listings that actually match your property (beds, baths, layout, amenities, proximity), models all three rental strategies, accounts for local regulations, and includes human review at every step. The result is a realistic, defensible analysis — not a ballpark.
Who is PropertyIQ for?+
PropertyIQ is built for buyers evaluating a purchase before committing, sellers who want to understand their property’s full income potential before listing, realtors who want to offer data-backed STR/MTR/LTR analysis as a client service, and investors or property managers evaluating multiple properties at once. If a property decision involves real money, a PropertyIQ report pays for itself.
Is PropertyIQ a real estate brokerage or financial advisor?+
No. PropertyIQ is an independent property performance analysis service. We provide data-driven analysis and projections to help you make more informed decisions. We do not provide legal, tax, or investment advice. Always consult a qualified professional for those needs.
What data sources does PropertyIQ use?+
We cross-reference data from multiple platforms and sources — not just Airbnb or AirDNA. Our analysis includes verified comparable active and historical listings, local market occupancy and ADR trends, regulatory and permit data, property-specific factors (layout, amenities, proximity to demand drivers), and human analyst review. No single data source tells the full story — ours doesn’t rely on one.
How are comparable properties selected?+
Comps are manually verified to match your property on the factors that actually drive performance: bedroom and bathroom count, square footage range, key amenities (pool, hot tub, parking, pet-friendly), proximity to your property, and actual booking performance. We exclude outliers and properties that don’t reflect your realistic competitive set. This is one of the most important steps — bad comps produce bad projections.
How accurate are the revenue projections?+
Our projections are cross-referenced across multiple data points and reviewed by a human analyst before delivery. They reflect realistic performance based on verified comps in your specific market — not national averages. That said, all projections are estimates. Actual performance depends on listing quality, management, pricing strategy, seasonality, and market conditions. We model conservative, moderate, and optimistic scenarios so you can evaluate the full range.
Does PropertyIQ cover regulations and STR permit requirements?+
Yes. Each report includes a regulatory overview for the property’s jurisdiction — covering permit requirements, zoning restrictions, HOA considerations, and any known STR caps or licensing rules. Regulations change frequently, so we always recommend verifying current requirements with your local municipality before proceeding.
How do I submit my property for analysis?+
After ordering, you’ll receive a confirmation with a simple property submission form. Provide the address, bedroom and bathroom count, square footage, current condition (pre- or post-renovation), and any unique features — such as a pool, hot tub, walkability, proximity to downtown, or existing rental history. The more detail you share, the more precise your analysis.
How long does a report take?+
Standard turnaround is 24–48 hours from the time we receive your completed property submission. 5-Report Pack clients receive priority turnaround. You'll receive your report as a secure, shareable link.
Can I request a revision if I have questions about my report?+
Yes. If you have questions about your analysis or want to explore a specific scenario (e.g., what if I add a hot tub, or what if I list as MTR only), reach out directly. We’re here to make sure you walk away with clarity, not just a document.
What Tax Strategies are covered in the report?+
Every PropertyIQ report includes an Tax Strategy summary covering Bonus Depreciation (accelerated deductions on furnishings and improvements), the 7-Day Rule (average stay under 7 days unlocks active loss treatment), W-2 Income Offset (STR losses can offset regular income), and Real Estate Professional Status (REPS) considerations. The report documents the projected income figures your CPA or cost segregation specialist needs to evaluate these strategies for your property.
Can a short-term rental really offset my W-2 income?+
Yes — under the right conditions. STRs are one of the few real estate strategies where losses are not automatically classified as passive. If you materially participate in the operation of your STR (which most active hosts do), those losses can offset W-2 and other active income dollar for dollar. This is a legal strategy used by high-income earners to significantly reduce their tax bill. Your PropertyIQ report documents the numbers; a qualified CPA executes the strategy.
Is the tax strategy analysis a substitute for a CPA or tax advisor?+
No. The Tax Strategy section in your PropertyIQ report is an informational summary designed to give you and your CPA a starting point. It documents projected income, ADR, occupancy, and annual revenue figures that a cost segregation specialist or tax professional needs to evaluate your specific situation. Always consult a qualified tax professional before making tax decisions.
What is the difference between Single, Bundle, 5-Report Pack, and Realtor Pack?+
Single ($199) covers one property with a full analysis. Bundle ($349) covers two properties and adds a cross-property comparison — saving $49 vs. two singles. The 5-Report Pack ($499) covers 5 full reports with priority turnaround and a dedicated contact — best for active investors and property managers evaluating multiple properties. The Realtor Pack ($799) is built for real estate agents: 10 full reports at $79.90 each, with priority 48-hour delivery, a dedicated point of contact, and white-label delivery options — designed for realtors ordering on behalf of clients across multiple transactions. All tiers include the full STR · MTR · LTR analysis, verified comps, and Tax Strategy summary.
Do unused reports in the 5-Report Pack roll over?+
The 5-Report Pack is a one-time purchase of 5 reports — not a monthly subscription. Use them at your own pace. There is no expiration.
Do unused reports in the Realtor Pack expire?+
No. The Realtor Pack ($799 / 10 reports) has no expiration. Reports do not roll over on a calendar — they simply stay in your account until you're ready to use them. Submit each property when it's relevant to a client transaction, and we'll deliver within 48 hours. This makes the Realtor Pack practical for agents who work with investors on an ongoing basis rather than all at once. For more details on the Realtor Program, see the Realtor Program section or the FAQ category below.
What markets do you cover?+
We cover all US markets. Our analysis is specific to the property’s local market, comparable listings, and regulatory environment — not a generic national estimate.
Is there a refund policy?+
Because each report involves significant analyst time and is custom-built for your property, we do not offer refunds once analysis has begun. If you have concerns about your report, contact us directly — we'll work with you to make it right.
What is the Realtor Program?+
The PropertyIQ Realtor Program is designed for real estate agents and brokers who want to offer data-backed property performance analysis as a premium service to their clients. Agents can order reports for any property — whether for a buyer evaluating a purchase, a seller preparing to list, or an investor running numbers. Reports can be delivered under your name, your brokerage brand, or co-branded with PropertyIQ. It's the fastest way to become the most data-driven agent in your market.
What is the Realtor Pack and how is it different from the 5-Report Pack?+
The Realtor Pack is a 10-report bundle priced at $799 — built specifically for active realtors who need volume and flexibility. Unlike the 5-Report Pack (designed for investors evaluating their own properties), the Realtor Pack is intended for realtors ordering on behalf of multiple clients across different transactions. It includes priority 48-hour delivery, a dedicated point of contact, and access to white-label delivery options. At $79.90 per report, it's the most cost-effective way to offer PropertyIQ as a client service.
Can I white-label PropertyIQ reports for my clients?+
Yes. White-label delivery is available through the Realtor Program. Your clients receive the full PropertyIQ analysis — STR, MTR, and LTR projections, verified comps, listing diagnostics, and Tax Strategy summary — presented under your name or brokerage. Contact us at [email protected] to discuss white-label setup.
How do I use the Realtor Pack reports?+
Reports in the Realtor Pack can be used for any property type, at any stage of a transaction — pre-listing analysis, buyer due diligence, investment property evaluation, or portfolio review. There is no expiration on unused reports. You submit each property when you're ready, and we deliver within 48 hours. Reports are delivered as secure, shareable links you can forward directly to your client.
Do agents earn referral fees or commissions?+
The Realtor Program is structured around report packs — you purchase reports at the agent rate and deliver them as a value-add to your clients. Referral arrangements and custom partnership structures are available for high-volume realtors and brokerages. Reach out to [email protected] to discuss options.
How do I get started with the Realtor Program?+
Email us at [email protected] with the subject line Realtor Program Inquiry — PropertyIQ. We'll respond within 24 hours to walk you through the program, answer questions, and get your first order set up. You can also order the Realtor Pack directly from the pricing section above.
Questions?
Still Unsure?
Not sure if a PropertyIQ report is right for your property? Book a free 15-minute strategy call or reach out directly — no obligation.
About
We Analyze First. Then We Recommend.
PropertyIQ is powered by Stays Optimized LLC — an active property optimization and consulting company with partnering teams across the US, operating in the markets we analyze. We have no incentive to push any strategy. Our job is to identify the highest and best use of your asset and give you the playbook to act on it.
Our managed properties consistently perform 20–40% above market average on both ADR and occupancy. When we give you a number, it comes from a live track record — not a spreadsheet.
Stay Ahead of the Market
Get STR Intelligence Delivered to Your Inbox
Join real estate agents and STR investors who receive our latest market insights, property performance tips, and exclusive PropertyIQ updates. No spam — unsubscribe anytime.
Or reach us directly at [email protected] · [email protected]
The People Behind Every Report
PropertyIQ is powered by an active network of property optimization specialists and managing partners operating in the markets we analyze.
Specializing in coastal and waterfront short-term rental markets, David brings deep expertise in STR setup, listing optimization, and revenue management for high-demand beach destinations.
Andrea leads property optimization and full-service STR hosting operations at Stays Optimized, overseeing strategic pricing, guest experience, and portfolio performance across multiple markets.
Jonathon brings hands-on STR management experience and a traveler-first perspective to the PropertyIQ network, helping property owners create memorable guest experiences that drive repeat bookings and strong reviews.
PropertyIQ is an active property optimization, management and consulting network with partnering teams across the US, operating in the markets we analyze.